
In the past, we have authored blog posts covering a wide range of topics, including various machine learning algorithms such as Classification and Prediction. Our aim has always been to assist you in enhancing your understanding of how machines function. We invite you to explore our website where we have shared insights on these subjects and more. Your feedback is of great value to us, as it allows us to refine our writing and provide even better content. Feel free to follow the provided links to access some of our featured articles.
In this blog post, we will delve into the concept of outliers and explore various methods used for outlier detection.
Imagine yourself in the role of a transactions auditor at a credit card company. Your primary responsibility is to safeguard customers from credit card fraud. To achieve this, you closely monitor credit card usages that deviate significantly from the norm. For instance, if a purchase amount greatly surpasses the usual spending pattern of a cardholder and if the transaction occurs in a location distant from the card owner’s usual residence, it raises suspicion. Identifying such transactions promptly and reaching out to the card owner for verification is a standard practice employed by many credit card companies.
The majority of credit card transactions follow predictable patterns. However, in cases where a credit card has been stolen, the transaction behavior typically undergoes drastic alterations. Purchase locations and the nature of items bought often diverge markedly from those of legitimate cardholders and other customers. The fundamental notion underpinning credit card fraud detection is to pinpoint transactions that exhibit substantial deviations from the norm. Consequently, the process of outlier detection revolves around identifying data instances that display behaviors significantly different from what is expected.
What are Outliers?
Imagine a statistical process employed to generate a collection of data objects. Within this context, an outlier refers to a data point that exhibits a considerable deviation from the rest of the objects. This deviation is substantial enough to suggest that the outlier might have been generated using a distinct mechanism compared to the other data points. In essence, an outlier stands out as if it were produced by an entirely separate process or pattern.
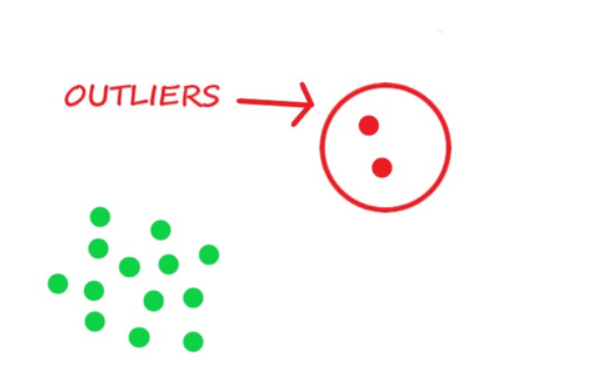
In the figure, most objects follow roughly a Gaussian distribution. However, the objects in the outliers are significantly different. It is unlikely that they follow the same distribution as the objects in the data set.
Types of Outliers
In general, outliers can be classified into three categories: global outliers, contextual outliers, and collective outliers. Let’s examine each of these categories.
Global Outliers
In a given data set, a data object is considered a global outlier if it deviates significantly from the rest of the data set. Global outliers are sometimes called point anomalies and are the simplest type of outliers. Most outlier detection methods aim at finding global outliers. Consider the points in the above figure. The points in the region outlier significantly deviate from the rest of the data set and are examples of global outliers.
Global outlier detection is important in many applications. Consider intrusion detection in computer networks, for example. If the communication behavior of a computer is very different from the normal patterns (a large number of packages are broadcast in a short time), this behavior may be considered a global outlier, and the corresponding computer is suspected of being a victim of hacking.
Contextual Outliers
“The temperature today is 28 oC. Is it exceptional?”. It depends, for example, on the time and location! If it is winter in Nepal, yes, it is an outlier. If it is a summer day in Nepal, then it is normal. Unlike global outlier detection, in this case, whether or not today’s temperature value is an outlier depends on the context, the date, the location, and possibly some other factors.
In a given data set, a data object is a contextual outlier if it deviates significantly with respect to its specific context. Contextual outliers are also known as conditional outliers because they are conditional on the selected context. Generally, in contextual outlier detection, the attributes of the data objects in the question are divided into two groups.
-
Contextual Attributes: The contextual attributes of a data object define the object’s context. In the temperature example, the contextual attributes may be date and location.
-
Behavioral Attributes: These define the object’s characteristics and are used to evaluate whether the object is an outlier in the context to which it belongs. In the temperature example, the behavioral attributes may be temperature, humidity, and pressure.
Collective Outliers
Suppose you are a supply chain manager at All Electronics. You handle thousands of orders and shipments every day. If the shipment of an order is delayed, it may not be considered an outlier because, statistically, delays occur on a single day. However, you have to pay attention if 100 orders are delayed in a single day. Those 100 orders as a whole form an outlier, although each of them may not be considered an outlier if considered individually.
Given a data set, a subset of data objects is considered a collective outlier if the objects as a whole deviate significantly from the entire data set. Importantly, the individual data objects may not be outliers.
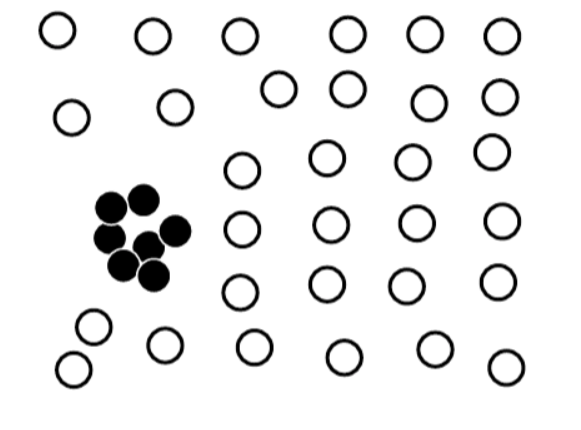
In figure 1, the black objects as a whole form a collective outlier because the density of those objects is much higher than the rest of the data set. However, every black object individually is not an outlier with respect to the whole data set. Collective outlier detection has many important applications. For example, in intrusion detection,a denial-of-service packet from one computer to another is considered normal and not an outlier at all. However, if several computers keep sending denial-of-service packages to each other, they as a whole should be considered a collective outlier. The computers involved may be suspected of being compromised by an attack.
Outlier Detection Methods
In both literature and practical applications, numerous outlier detection methods exist. We can categorize these methods using two distinct approaches. Firstly, we can classify them based on whether the dataset used for analysis includes domain expert-provided labels that facilitate the construction of an outlier detection model. Secondly, we can organize these methods into groups depending on their assumptions about differentiating between normal data objects and outliers.
Supervised Methods Supervised methods encompass the modeling of both data normality and abnormality. In this approach, domain experts assess and label a subset of the underlying data. Subsequently, outlier detection can be framed as a classification problem. The objective involves training a classifier to effectively identify outliers. The labeled subset of data serves as the foundation for both training and testing the classifier. It’s worth noting that in certain scenarios, experts might exclusively label the normal data objects. Consequently, any objects that deviate from the established model of normality are flagged as outliers.
Unsupervised Methods In certain application scenarios, the availability of labeled objects as “normal” or “outlier” is not feasible. Consequently, the utilization of an unsupervised learning method becomes necessary. Unsupervised methods are grounded in the assumption that normal objects adhere to a specific pattern much more frequently than outliers.
Normal objects need not be confined to a single group that shares high similarity. Instead, they can manifest in multiple groups, each characterized by distinct features. However, an outlier is anticipated to exist significantly distant in feature space from any of the established groups of normal objects. This disparity in feature space serves as a key differentiator between normal and outlier data points within unsupervised outlier detection methods.
Semi-Supervised Methods In numerous scenarios, while obtaining a few labeled examples is achievable, the quantity of such labeled instances tends to be limited. Situations arise where only a small subset of both normal and/or outlier objects can be labeled, leaving the majority of the data unlabeled. To address these scenarios, the development of semi-supervised outlier detection methods has been crucial.
Semi-supervised outlier detection methods can be seen as applications derived from semi-supervised learning techniques. For instance, when there are labeled normal objects at hand, these labeled instances can be combined with nearby unlabeled objects to create a model for normal objects. This model of normal behavior can then be employed to classify potential outliers based on their deviation from the learned normal behavior. This approach leverages the available labeled data while also benefiting from the information contained in the larger pool of unlabeled data points.
Statistical Method Statistical methods are grounded in the assumption of data normality. They propose that data objects conforming to a statistical model are deemed normal, while objects that deviate from this model are identified as outliers. In the context of the first figure mentioned earlier, the data points situated outside the defined outlier region adhere to a Gaussian distribution. This Gaussian distribution, representing the probability density at various locations in the data space, is employed to model the behavior of the majority of data points in the dataset.
In the case of the objects falling within the region labeled as outliers, we can create estimates for their respective Gaussian distributions. The probability of a given data point in the outlier region adhering to its estimated Gaussian distribution can then be calculated. Due to the inherent unlikelihood that a data point’s distribution in the outlier region aligns with the Gaussian model generated by the majority of data points, such data points are classified as outliers. This approach capitalizes on the Gaussian distribution’s ability to represent normal data patterns and identify deviations, ultimately assisting in pinpointing outliers.
The effectiveness of statistical methods highly depends on whether the assumptions made for the statistical model hold true for the given data. There are many kind of statistical models. For example, the statics methods used in the methods may be parametric or nonparametric.
Proximity-Based Methods Proximity-based methods assume that an object is an outlier if the nearest neighbors of the object are far away in feature space; that is, the proximity of the object to its neighbors significantly deviates from the proximity of most of the other objects to their neighbors in the same data set. Consider the object in the first figure above. If we model the proximity of an object using its three nearest neighbors, then the objects in the outlier region are substantially different from other objects in the data set. For the two objects in the outlier, their second and third nearest neighbors are dramatically more remote than those of any other objects. Therefore, we can label the objects in the region as outliers based on proximity.
The effectiveness of proximity-based methods relies heavily on the proximity measure used. In some applications, such measures cannot be easily obtained. Moreover, proximity-based methods often have difficulty in detecting a group of outliers if the outliers are close to one another.
Clustering-Based Methods Clustering-based methods assume that the normal data objects belong to large and dense cluster, whereas outliers belong to small or sparse clusters, or do not belong to any clusters.
In above figure first, there are two clusters. Cluster c1 containing all the points in the data set except for those in region outliers. Cluster C2 is tiny containing just two points in outlier. Cluster C1 is large in comparison to C2. Therefore, a clustering-based methods asserts that the two objects in outlier are outliers.
Clustering is an expensive data mining operation. A straightforward adaption of a clustering method for outliers detection can be very costly, and thus does not scale up well for large data sets.
Challenges of Outlier Detection
Outlier detection is useful in many applications yet faces many challenges such as the following,
Modeling Normal Objects and Outliers Effectively The effectiveness of outlier detection is significantly reliant on the accuracy of the models created for both normal (non-outlier) objects and outliers. However, constructing a thorough model for data normality can prove to be exceedingly difficult, if not entirely unattainable. This challenge stems from the complexity of encapsulating all potential normal behaviors within a given application.
Enumerating all conceivable normal patterns within a dataset often proves to be a formidable task due to the inherent intricacies of real-world scenarios. The diverse range of behaviors exhibited by data in various contexts contributes to the complexity of achieving a comprehensive model for data normality. This challenge underscores the need for adaptable and robust outlier detection methods that can effectively navigate the uncertainties and intricacies present in real-world data.
Application-Specific outlier detection Indeed, the selection of an appropriate similarity or distance measure, as well as the relationship model used to characterize data objects, plays a pivotal role in outlier detection. However, making such choices is inherently contingent on the specific application at hand. Different applications tend to present varied demands and considerations that influence these decisions.
Consider the scenario of clinical data analysis, where even a minor deviation can hold considerable significance and thus warrant the identification of an outlier. Conversely, in the realm of marketing analysis, data objects often encounter more substantial fluctuations, necessitating a far greater deviation to qualify as an outlier. These examples underscore how the choice of similarity or distance measures, as well as the criteria for detecting outliers, is intimately tied to the contextual nuances and objectives specific to each application.
Handeling Noise in Outlier Detection As previously mentioned, outliers are distinct from noise. It’s also widely acknowledged that real-world datasets often exhibit poor quality. Noise frequently emerges in data collected across numerous applications, sometimes in the form of deviations within attribute values or even as missing values. The prevalence of noise and the general low quality of data pose considerable challenges to outlier detection.
The existence of noise can introduce distortions into the data, making it more challenging to differentiate between normal data objects and outliers. This blurring effect can undermine the effectiveness of outlier detection techniques, as the presence of noise can lead to misinterpretations and inaccurate identifications. The inherent difficulty in isolating genuine anomalies from noise underscores the critical nature of data cleaning and preprocessing in outlier detection tasks.
Understandability In certain practical scenarios, users might not only seek to identify outliers but also desire an understanding of the reasons behind the detected outliers. To fulfill this need for comprehensibility, an outlier detection method must offer explanations for the detections made. One way to provide such explanations is by employing a statistical approach.
For instance, a statistical method can offer a justification for the extent to which an object could be deemed an outlier. This justification hinges on the likelihood that the object in question was generated using the same mechanism responsible for generating the majority of the dataset. A lower likelihood value signifies that the object is less probable to have originated from the same mechanism, which in turn implies a higher likelihood of it being an outlier. In this manner, a statistical method not only detects outliers but also provides a quantifiable measure of their distinctiveness, enhancing the user’s understanding of the outliers’ nature and significance.
References
-
https://www.google.com/search?q=images+of+collective+outliers&tbm=isch&ved=2ahUKEwjXtu2hscj7AhVqjtgFHcDnDVsQ2-cCegQIABAA&oq=images+of+collective+outliers&gs_lcp=CgNpbWcQAzoFCAAQgAQ6BAgjECc6BAgAEEM6BwgAELEDEEM6CAgAEIAEELEDOgYIABAFEB46BggAEAgQHlCiFViQUWDdV2gAcAB4AIABmwGIAZobkgEEMC4zMJgBAKABAaoBC2d3cy13aXotaW1nwAEB&sclient=img&ei=wTWAY5fSDOqc4t4PwM-32AU&bih=715&biw=1496&client=opera&hs=34n#imgrc=Ziab4kNZBWW6-M
-
https://www.google.com/search?q=images+of+outliers&tbm=isch&ved=2ahUKEwi2ocKYscj7AhVJj9gFHU7tAsgQ2-cCegQIABAA&oq=images+of+outliers&gs_lcp=CgNpbWcQAzIFCAAQgAQ6BAgjECc6BwgjEOoCECc6CAgAEIAEELEDOgcIABCxAxBDUJcEWLU9YMlCaAFwAHgEgAGWAYgBhiWSAQQwLjQxmAEAoAEBqgELZ3dzLXdpei1pbWewAQrAAQE&sclient=img&ei=rTWAY_aWJsme4t4PztqLwAw&bih=715&biw=1496&client=opera&hs=34n#imgrc=GFrAVh4xlm5RUM
-
Book(Data Mining Concept and Technology)


Comments