
Kruskal Wallis H Test
What is Kruskal Wallis H Test
Kruskal Wallis H test is a kind of non parametric test which means that there is no presence of parameter and parent population from which sample has been taken is not normally distributed. Kruskal Wallis H test is also khown as non parametric version of one way ANOVA. ANOVA test stands for analysis of variance. If we have more than three comparable groups and parent population from which sample have been taken is normally distributed then at that case we use one way ANOVA test. However if we have more than three comparable groups and parent populations from which sample have been taken is not normally distributed then we used Kruskal Wallis H test. Kruskal Wallis H test is also known as extension of Mann Whitney U test. If we have only two comparable groups and parent population from which sample have been taken is not normally distributed then we used Mann Whiteny U test.
What are the essential criteria to use Kruskal Wallish H test
The main criterias to use H test are listed below,
- There must be more than three comparable groups.
- Parent population from which sample have been drown is should not be normally distributed.
- The numbers of obseravation in each comparable groups should be more than 5.
- Numbers of observations in each comparable groups is 5 or more hence distribution approximate to chi-square distributin.
What Does the Null and Alternative Hypothesis represent
In general, hypothesis is any kid of assumption. But in statistical sense hypothesis test is method used to decide where the data provide sufficient support to reject particular hypothesis. There are two types of hypothesis. These are set in the following way while using Kruskal Wallis H test.
Null Hypothesis: \(H0: \mu_{1} = \mu_{2}=...=\mu_{k}\) It is also known as hypothesis of no difference. That means k independent sample have been taken from the population which are identically distributed.
Alternative Hypothesis : \(H1: \mu_{1} \neq \mu_{2}\neq...\neq\mu_{k}\).
It is complementry to the null hypotheis. That means k independent sample have been taken from the population which is not identically distrubuted.
Application and one example
Example Kruskal Wallis in News Data
The objective of this test in the News Data is to question whether the number of word counts in each News Category Group is identical or not.
Import Necessary Modules
Lets import some necessary libraries to do Kruskal Wallis Test and some pre-processing of our data.
os: The OS module in Python provides functions for interacting with the operating system and file systems.pandas: Working for DataFramenumpy: For array operation.matplotlib: For visualizationseaborn: For more effictive data visualization.warnings: Warnings is used to supress the warnings.
import pandas as pd
import numpy as np
import matplotlib.pyplot as plt
from matplotlib.pyplot import figure
from matplotlib.font_manager import FontProperties
import seaborn as sns
import warnings
warnings.filterwarnings("ignore")
import pprint
import os

plt.style.use("seaborn-whitegrid")
The generic font family is listed as a backup in case the system does not have either of these but has another serif. In order to show Devanagari font in the plots, we will be using Mangal Font. Which is available in the internet and I placed it in my working directory.
font_path = '/content/drive/MyDrive/News Scraping/News classification/Mangal Regular.ttf'
font_prop = FontProperties(fname=font_path ,size=25)
Load CSV file
Currently the data is in my google drive. But I am doing all these tasks in my Google Colab so, I will read data from my drive. I also request you to read blog about how I scraped news.
Since we have CSV files for distinct day, we need all of the file’s content to be combined before doing a analysis task. I have done following to merge different csv files. I regularly scraped the news and these were saved in different csv file in each day. And I combined all csv file for the task.
all_filenames = [i for i in os.listdir("/content/drive/MyDrive/News Scraping/data") if  ".csv" in i and "combined" not in i]
print(all_filenames)
['2021-03-25.csv', '2021-03-26.csv', '2021-03-27.csv', '2021-03-28.csv', '2021-03-29.csv', '2021-03-30.csv', '2021-03-31.csv', '2021-04-01.csv', '2021-04-03.csv', '2021-04-04.csv', '2021-04-05.csv', '2021-04-06.csv', '2021-04-07.csv', '2021-04-08.csv', '2021-04-12.csv', '2021-04-13.csv', '2021-04-14.csv', '2021-04-15.csv', '2021-04-16.csv', '2021-04-17.csv', '2021-04-18.csv', '2021-04-19.csv', '2021-10-09.csv', '2021-10-10.csv', '2021-10-20.csv', '2021-10-21.csv', '2021-10-22.csv', '2021-10-23.csv', '2021-10-24.csv', '2021-10-25.csv', '2021-10-26.csv', '2021-10-27.csv', '2021-11-21.csv', '2021-11-22.csv', '2021-11-25.csv', '2021-11-28.csv', '2021-11-29.csv', '2021-11-30.csv', '2021-12-05.csv', '2021-12-25.csv', '2022-01-02.csv', '2022-01-04.csv', '2022-01-11.csv', '2022-01-13.csv', '2022-01-18.csv', '2022-03-26.csv', '2022-03-27.csv', '2022-04-04.csv']
# get root of the data
root = "/content/drive/MyDrive/News Scraping/data/"
combined_csv = pd.concat([pd.read_csv(root+f) for f in all_filenames])
df = combined_csv.copy()
Data Cleaning
Here we are going to clean our original data. Originally data contains noise as well as, many words which does not contribute any significant value on our task. In below code block we are going to remove these all noises.
- First we have a stopwords text file.
- And then punctuation text file.
Both of above files are available in GitHub repo.
stop_file = "/content/drive/MyDrive/News Scraping/News classification/nepali_stopwords.txt"
stop_words = []
with open(stop_file) as fp:
  lines = fp.readlines()
  stop_words =list( map(lambda x:x.strip(), lines))

punctuation_file = "/content/drive/MyDrive/News Scraping/News classification/nepali_punctuation (1).txt"
punctuation_words = []
with open(punctuation_file) as fp:
  lines = fp.readlines()
  punctuation_words =list( map(lambda x:x.strip(), lines))
punctuation_words

def preprocess_text(cat_data, stop_words, punctuation_words):
  new_cat = []
  noise = "1,2,3,4,5,6,7,8,9,0,०,१,२,३,४,५,६,७,८,९".split(",")

  for row in cat_data:
    words = row.strip().split(" ")
    nwords = "" # []

    for word in words:
      if word not in punctuation_words and word not in stop_words:
        is_noise = False
        for n in noise:
          #print(n)
          if n in word:
            is_noise = True
            break
        if is_noise == False:
          word = word.replace("(","")
          word = word.replace(")","")
          # nwords.append(word)
          if len(word)>1:
            nwords+=word+" "

    new_cat.append(nwords.strip())
  # print(new_cat)
  return new_cat

title_clean = preprocess_text(["शिक्षण संस्थामा ज जनस्वास्थ्य 50 मापदण्ड पालना शिक्षा मन्त्रालयको निर्देशन"], stop_words, punctuation_words)
print(title_clean)
['शिक्षण संस्थामा जनस्वास्थ्य मापदण्ड पालना शिक्षा मन्त्रालयको निर्देशन']
We can see in the result above that the single letter ज is removed as well as 50.
Now making a new dataframe to do processing of text and use it later on.
ndf = df.copy()
ndf = ndf[~ndf.Content.isna()]
for i, row in ndf.iterrows():
  ndf.loc[i, "Content"]= preprocess_text([row.Content], stop_words, punctuation_words)[0]

#ndf
View News Counts Per Category
plt.figure(figsize=(15,8))
ndf.groupby("Category").Content.count().plot(kind="bar")
plt.xlabel("Category",fontsize=15)
plt.ylabel("News Counts",fontsize=15)
plt.title("News Counts Per Catrgory",fontsize=20)
plt.yticks(fontsize=15)
plt.xticks(fontsize=15)

plt.show()
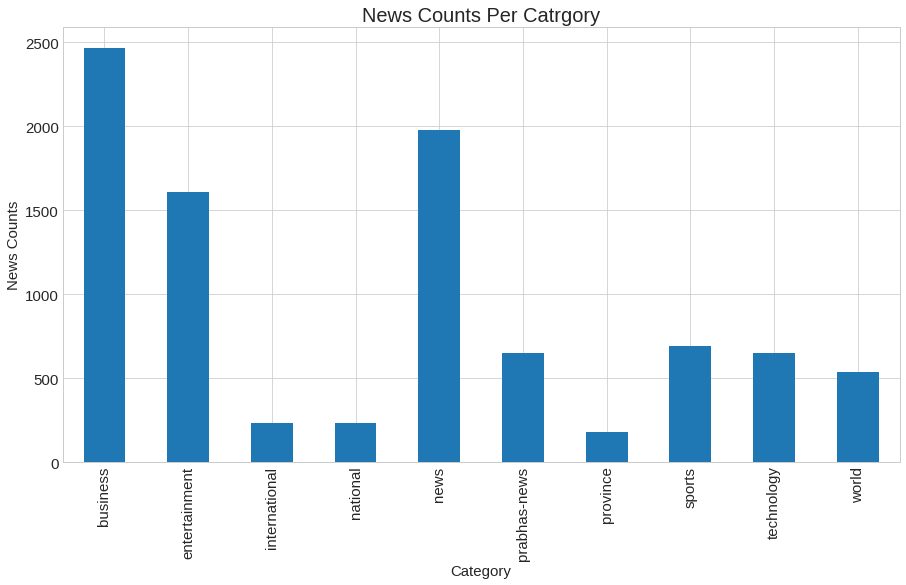
In the image above, a bar plot of news counts by category is displayed. In horizontal axis we kept Category name whereas in vertical axis we kept News Count. From figure we can see that business category contains maximum almost 2400 words similarly new category contains nearly 2000 words. The minimum number of words is present in the national, province, and international categories. Here, our major objective is to determine whether or not new words are distributed uniformly across categories. In order to test this, we will use Kruskal-Wallis hypothesis testing. But first, lets get the number of word counts in each news.
We need to perform a few additional tasks before applying the Kruskal-Wallis H test to determine whether our data is normally distributed, whether the variance within each category is homogenous or not, whether outliers are present in our data, and whether our samples are independent of one another. Here, we need to do following tests before doing Kruskal Wallis H test:
- Normality Test
- Varience Test
- Outliers Detection
- Sample are independent or not
Counts of Words in News (Histogram)
plt.figure(figsize=(15,8))
ndf["content_words"] = ndf.Content.apply(lambda x : len(x.split(" ")))
ndf.content_words.hist(bins= 50)
plt.xlabel("Word Count")
plt.ylabel("Count Frequency")
plt.title("Word Count vs Count Frequency")
plt.show()
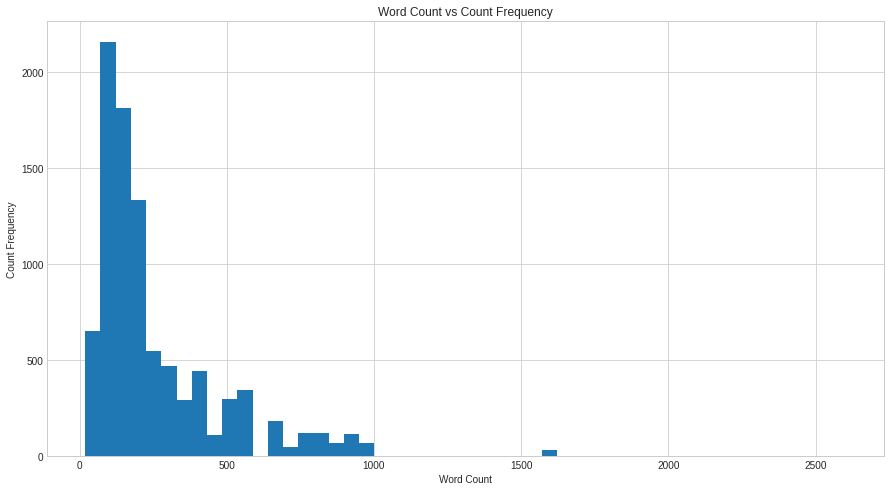
We can observe from the histogram that the distribution of our data is not normal but left skewed. Our data should be normally distributed if the histogram is bell-shaped or nearly bell-shaped. However, there is no pattern in our data at all. From this we can conclude that our data is not normally distributed. Let’s perform another standard check just to be sure. To do that, we will do Normality Test.
Normality Test
We will be using SciPy’s Normaltest. Please follow the documentation for more info about it.
from scipy import stats
From documentation,
This function tests the null hypothesis that a sample comes from a normal distribution. It is based on D’Agostino and Pearson’s test that combines skew and kurtosis to produce an omnibus test of normality.
ntest = stats.normaltest(ndf.content_words)
ntest
NormaltestResult(statistic=4789.423094578761, pvalue=0.0)
This function’s null and alternative hypothesis would be,
Ho: Data follow normal distribution
H1: Data does not follow normal distribution
How to make the decision whether data is normal or not?
The p value is used to assess if the distribution of our data is normal. If the p value exceeds 0.05, the null hypothesis is not rejected. P values less than 0.05 provide strong support for the null hypothesis being rejected. Our p value in the aforementioned test instance is 0.0, which indicates that the null hypothesis is rejected. This suggests that the distribution of our data is not normal.
Now we will do variance test.
Variance Test
Our goal is to find whether the variance of word count in each category is homogenous or not. So first, lets find the word count in each category by grouping as belows.
wndf = ndf.groupby("Category").apply(lambda x: x.content_words.tolist()).rename("word_lists").reset_index()
wndf
| Category | word_lists | |
|---|---|---|
| 0 | business | [579, 233, 431, 866, 215, 292, 537, 352, 387, ... |
| 1 | entertainment | [131, 901, 96, 105, 111, 295, 108, 45, 158, 98... |
| 2 | international | [188, 148, 45, 189, 187, 184, 74, 50, 146, 198... |
| 3 | national | [74, 50, 146, 198, 205, 32, 80, 170, 19, 209, ... |
| 4 | news | [706, 668, 214, 85, 550, 34, 195, 166, 108, 10... |
| 5 | prabhas-news | [295, 122, 167, 987, 340, 426, 181, 318, 1602,... |
| 6 | province | [61, 134, 46, 162, 205, 188, 148, 45, 187, 61,... |
| 7 | sports | [353, 520, 177, 184, 81, 570, 97, 182, 142, 23... |
| 8 | technology | [334, 143, 213, 78, 115, 203, 171, 122, 126, 8... |
| 9 | world | [81, 84, 40, 120, 158, 214, 508, 489, 332, 172... |
The data shown above shows the number of words in each category. The first number is 579 in the entertainment field, 131 in the international field, and 188 in the international field; it means that if the word management appears 579 times in business, the same word appears 131 times in entertainment, and similarly 188 times in the international field.
To test varience across our category we used levene test because we have more than three comparable groups. Here null and alternative hypothesis would be,
Ho: Varience across category is homogenious
H1: Varience across category is not homogenious
from scipy.stats import levene
data = wndf.word_lists.tolist()
stat, p = levene(*data)
print(p)
2.047384476196827e-85
How to make decision is the varience is homogenious or not?
For this, we should look at p vale. If p values are higher than 0.05, the null hypothesis is not disproved. The null hypothesis is supported by the data if p-value is less than 0.05.
In this case, the p value is less than 0.05, indicating that our null hypothesis is rejected, indicating that variation across categories is not uniformly distributed.
Is there any presence of outliers?
This is the another test we need to do, and we check if there are outliers in each data category.
g = ndf.groupby('Category')

fig, axes = plt.subplots(g.ngroups, sharex=True, figsize=(5, 20))

for i, (country, d) in enumerate(g):
    ax = d.plot.box(x='content_words', ax=axes[i], title=country)

fig.tight_layout()

Kruskal Wallis
Now comes the final part, as we knew that our data can be used for Kruskal Wallis test. Now we pass the word counts data in Kruskal method of SciPy’s stats.
stats.kruskal(*wndf.word_lists.tolist())
KruskalResult(statistic=432.3802961754277, pvalue=1.6716612649337708e-87)
Looking over the returned p-value above, we can conclude that the number of word counts in each category is not identical distributed.
Thank you so much for finding this blog and please provide feedbacks too.

Comments