
Introduction
To manipulating vectors means we perform some arithmetics operation on these vectors. By performing some arithmetics on vectors resulting vectors or any value can represent very interesting fact or inside. This is very interesting inside that we perform some operation on the given data and result represent more interesting fact about the data.
This blog has been written by taking Coursera’s NLP Specialization as a reference. Hence, the images used in this blog are from that course itself. All credit goes to Coursera.
How to manipulate word as vectors
By manipulating word as vector we can draw some information on the basis of available information. For example we know that capital city of Palpa district is Tansen but we don’t know that capital city of Gulmi district or capital city of Rupandehi district. So, with the help of Palpa has capital city Tansen we can find out Capital city of Gulmi district by performing vector operation.
Assume we have a vector space with the names of all the nations and their capitals. we are aware that the capital of the United States is Washington, DC, but we are unaware of Russia’s capital. However, we’d prefer to determine it using the established connection between Washington, DC, and the USA. We’ll just need to utilize some vector algebra for that. In this illustration, we are in a fictitious two-dimensional vector space that has various representations of many nations and capital cities.
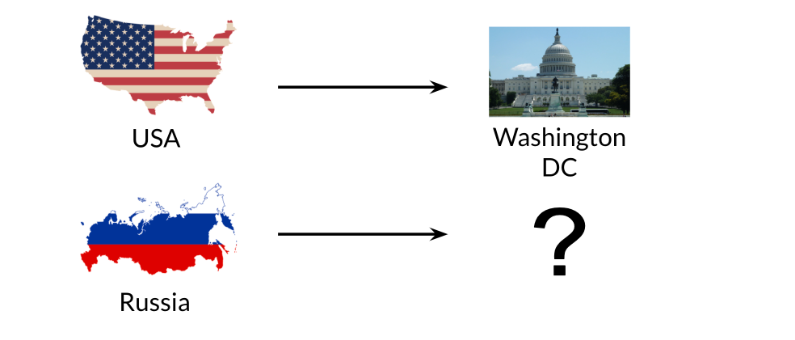
We must first establish a connection between the vector representations of Washington, DC, and the USA. Which vector, in other terms, links them? Get the difference between the two vectors to accomplish that. We can find a country’s capital in a vector space by using the values from that to determine how many units we should walk in each direction. We must add its vector representation to the vector we also obtained in the preceding stage in order to determine the capital city of Russia.
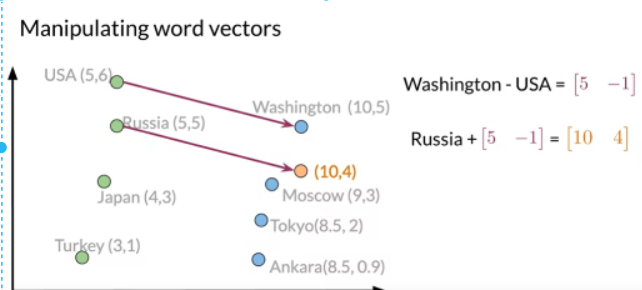
We should conclude that the vector representation of the Russian capital is 10, 4, at the conclusion. However, since there aren’t any cities with that representation, we’ll have to choose the one that compares to it most closely by comparing each vector’s cosine similarity or Euclidean distance. The vector representation for Moscow is the one in this instance that is most closely related to the 10, 4. If we knew the capital of the USA, we might have used the straightforward approach to forecast the capital of Russia. The only catch is that we require a vector space in which word representations capture their contextual meaning. We now have a straightforward method for obtaining unknown associations between words using those between other words that are known to exist. We now recognize the value of vector spaces whose word representations accurately reflect their contextual meaning in real language.
How to Plot D dimension In 2D plot
We frequently wind up with vectors that have a lot of dimensions. We’re trying to discover a technique to make these vectors just have two dimensions. In order to plot it, we need an XY axis. For this purpose principle component will be use. PCA is mainly used to reduced the high dimension data into few dimension these feature still contain all information of original data.
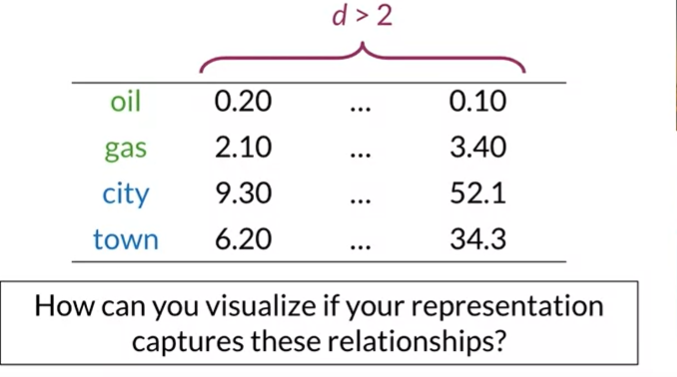
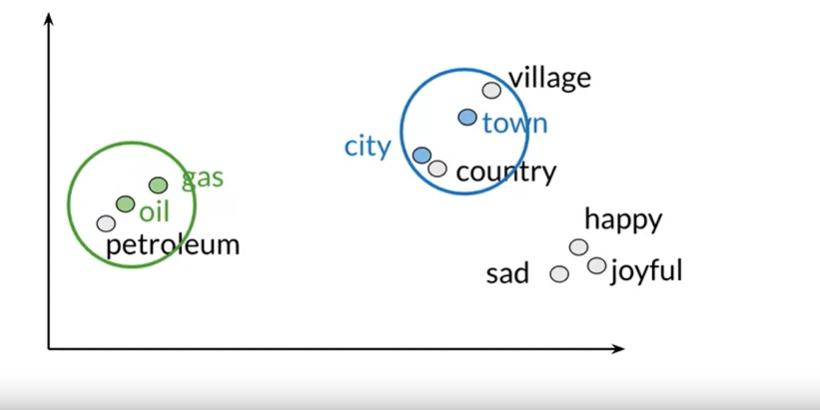
Imagine our words were represented as follows in a vector space. Given that the phrases “oil and gas” and “sitting in town” are related in this case, our vector space dimension is greater than that. And we want to check to determine if our words’ representation of that relationship does so. Therefore, dimensionality reduction is a fantastic option for this work. It allows us to visualize our words in order to see this and other potential correlations.
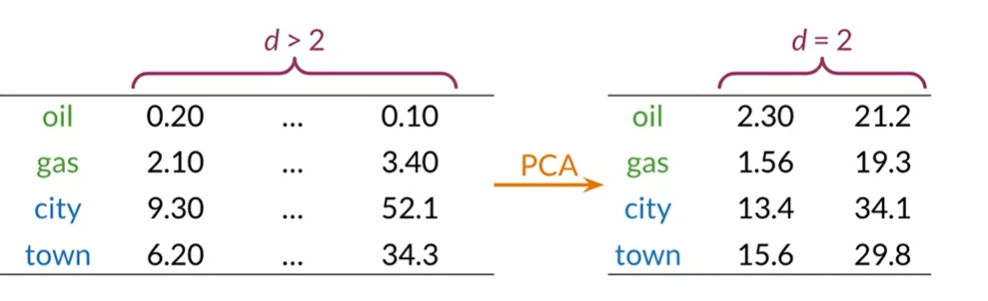
An method like PCA can be used to obtain a representation of our words in a vector space with less dimensions when they are already represented in a high-dimensional space. We can obtain a simplified representation with three or fewer variables if we want to visualize our data.We can plot a visual representation of our words if we run principal component analysis on our data and obtain a two-dimensional representation. In this instance, we may discover that our first interpretation accurately reflected the connection between the terms “oil and gas” and “city and town.” because they seem to be grouped together with related terms in our two-dimensional space.
How to Visualize Word
In this instance, we may discover that our first interpretation accurately reflected the connection between the terms “oil and gas” and “city and town.” because they seem to be grouped together with related terms in our two-dimensional space. Even unexpected relationships between our words can be discovered. Which is both entertaining and practical.In order to project our data into a one-dimensional space while retaining as much information as feasible, we will first choose a set of uncorrelated attributes. This procedure is fairly simple, as we can see. We’ll explore in more detail how this method operates in the following section, along with how to obtain uncorrelated characteristics. To represent our data in a lower dimension while preserving as much information as feasible, we will also project our data.
PCA Algorithm
- Get a dataset with K features.
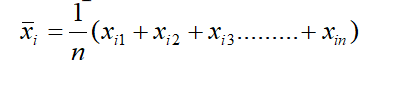
- Compute the mean of dataset using the formula
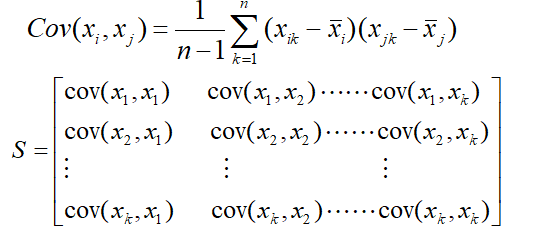
- Compute the covariance matrix of each of the feature pair, using the formula
- Compute eigenvalues and normalized eigenvectors of the covariance matrix.
- The normalized eigenvector corresponding to the largest eigenvalue is the first principle component.
In PCA Eigenvectors represent uncorrelated feature of our data and eigenvalues represent amount of information retained by each features. Also each eigenvalue has a corresponding eigenvector. The eigenvalue tells you how much variance there is in the eigenvector.

Comments